-

Bachelor's

-

Masters
-

MBA
-

Doctorate
-

Micro Credit
-

Explore all Courses
-
Postgraduate Certifications

-
Postgraduate Diploma
-
Undergraduate Diploma
-
Diploma


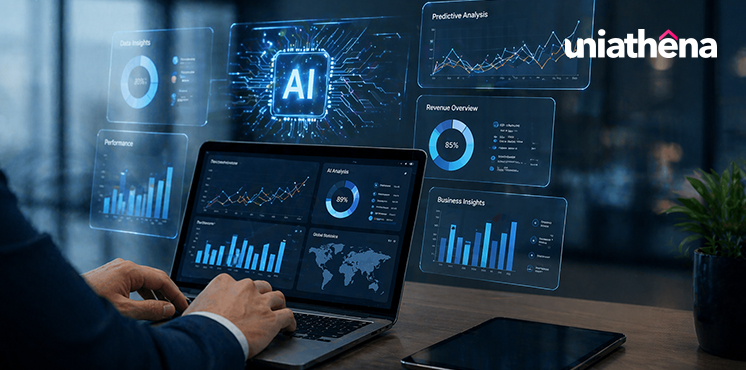
How AI is Transforming Business Analytics
Author: maharajan p
|6
MINS READ
| 0
| 83
Created On: 01 June, 2026
Share


Table of Contents (TOC):
- Introduction
- Key Takeaways
- What is Business Analytics?
- How Business Analytics Worked Before AI
- How AI is Transforming Business Analytics
- Benefits of AI in Business Analytics
- Skills Needed to Work with AI in Business Analytics
- Conclusion
- FAQs
Introduction
Businesses rely on data to understand performance, track changes, and make decisions. Traditionally, this process depended on reports, dashboards, and manual analysis, which often limited how quickly insights could be generated.
With the introduction of AI in analytics, the way business analysts work has started to change. Analysts can now ask complex questions, explore new data points, and generate custom visualizations with less manual effort. In addition to this, AI can process large datasets, identify patterns, and support faster decision-making.
Key Takeaways:
- Artificial intelligence shifts business analytics from descriptive reporting to predictive modeling, enabling businesses to forecast outcomes instead of only analyzing past performance.
- Traditional manual workflows are replaced by automated data processing, reducing time spent on cleaning, preparation, and repetitive analytical tasks.
- Real-time data processing allows businesses to monitor performance continuously and respond quickly instead of relying on delayed, scheduled reports.
- The role of analysts is evolving from data preparation to interpreting AI-driven insights and supporting more consistent, data-backed decision-making.
What is Business Analytics?
Business analytics is the process of using data to understand how a business is performing and to support decision-making. It involves collecting data from different sources, organizing it, and analyzing it to identify patterns or trends that can guide actions.
Traditionally, this analysis is carried out using reports, spreadsheets, and manual interpretation. Teams spend time cleaning data, building reports, and making decisions based on what they observe from past performance.
How Business Analytics Worked Before AI
Business analytics traditionally relied on structured data processing and manual analysis carried out by business analysts and reporting teams. The workflow was step-by-step, with each stage depending heavily on human effort and interpretation.
1. Data Collection
Analysts gathered data from multiple internal business systems such as:
- Sales records
- Customer databases (CRM systems)
- Operational and inventory reports
- Financial statements
This data was often stored across different platforms and needed to be pulled together for analysis.
2. Data Cleaning and Preparation
Once collected, the raw data was prepared for analysis. This step included:
- Removing duplicates and errors
- Handling missing values
- Formatting data into usable structures
Tools commonly used:
- Microsoft Excel
- Basic SQL queries for database extraction
3. Data Analysis and Reporting
After preparation, analysts worked on identifying patterns and preparing reports using:
- Excel (pivot tables, charts, formulas)
- Business Intelligence tools like Tableau or Power BI
These outputs were usually:
- Static dashboards
- Scheduled reports (weekly, monthly, or quarterly)
4. Interpretation and Decision Support
Finally, analysts interpreted the reports to:
- Identify trends and performance changes
- Compare current results with past data
- Support business decisions based on historical insights
At this stage, insights were largely dependent on manual analysis and the analyst’s understanding of the data.
How AI is Transforming Business Analytics
AI is changing business analytics by shifting it from rule-based reporting systems to model-driven systems that can learn from data, detect patterns, and generate outputs without explicit manual instructions for every step.
1. From Descriptive → Predictive Analytics
Traditional analytics focuses on descriptive reporting, where systems summarize historical data using predefined queries.
AI introduces predictive modeling.
- Descriptive analytics uses SQL queries, OLAP cubes, and BI dashboards to show “what happened”
- AI applies machine learning models trained on historical datasets
- These models learn relationships between variables (e.g., price, demand, seasonality)
- Output shifts from static reports to probability-based forecasts
Example: Instead of reporting last month’s churn rate, AI estimates which customers are likely to churn next.
2. From Manual Processing → Automated Data Handling
Earlier workflows required analysts to manually prepare datasets before analysis.
AI reduces dependency on manual preprocessing through automation and learning-based data handling.
- Data cleaning tasks (missing value imputation, duplicate detection) can be automated using ML-based rules
- Feature engineering can be partially automated using algorithms that identify relevant variables
- ETL (Extract, Transform, Load) pipelines become adaptive rather than static scripts
- Large-scale datasets can be processed using distributed ML systems
This shifts the analyst’s role from data preparation executor to data validation and interpretation specialist.
3. From Static Reports → Real-Time Insights
Traditional BI systems operate in batch mode, where data is refreshed at scheduled intervals.
AI enables streaming analytics and continuous model inference.
- Data ingestion happens in real time (event-driven systems, APIs, sensors, clickstreams)
- Models continuously update predictions as new data arrives
- Dashboards reflect live changes instead of periodic snapshots
- Anomaly detection systems flag deviations instantly
This enables near real-time decision support instead of delayed reporting cycles.
4. From Human-Driven → Data-Driven Decisions
Earlier, decision-making depended heavily on manual interpretation of reports and analyst judgment.
AI introduces decision support systems powered by statistical learning.
- Models identify nonlinear relationships that are difficult to detect manually.
- Correlation and clustering algorithms group similar patterns in data.
- Recommendation systems suggest next-best actions based on historical behavior.
- Decision outputs are ranked by probability or confidence scores.
This reduces reliance on subjective interpretation and increases consistency in decision logic.
Benefits of AI in Business Analytics
AI is reshaping business analytics by shifting it from slow, manual interpretation to faster, more intelligent, and scalable decision-making. It helps businesses work with large volumes of data without increasing complexity.
- Enables faster analysis of large and complex datasets.
- Improves accuracy by reducing human errors in data interpretation.
- Helps identify hidden patterns that are difficult to detect manually.
- Supports real-time insights instead of delayed reporting cycles.
- Automates repetitive data preparation and reporting tasks.
- Enhances forecasting through predictive modeling techniques.
- Improves decision-making with more data-driven recommendations.
Skills Needed to Work with AI in Business Analytics
Working with AI in business analytics requires a mix of technical skills, analytical thinking, and an understanding of how AI models interact with data. These skills help analysts move from basic reporting to building, interpreting, and using AI-driven insights effectively.
Core skills to develop:
- SQL and Data Querying to extract, filter, and manage structured data from databases.
- Programming (Python or R) to handle data processing, analysis, and basic model building.
- Machine Learning Fundamentals to understand how models learn patterns and make predictions.
- Prompt Engineering to interact effectively with AI tools and generate useful outputs.
- Data Visualization to present insights clearly using charts and dashboards.
- Cloud platforms to work with scalable data systems and AI tools.
- Critical Thinking and Domain Knowledge to interpret results and connect them to business decisions
These skills may look broad at first, but they are usually learned step by step. Most learners start with data handling and programming, then move into AI concepts and visualization.
To make that path clearer, here are a few structured courses that align with each of these focus areas.
Conclusion
AI is not replacing business analytics, but it is changing how analysis is done and how decisions are made. Tasks that once required manual effort and time can now be handled faster, with more consistency and depth.
For anyone working with data, this shift means one thing: the role is evolving. Understanding data is still important, but knowing how to work with AI tools and interpret model-driven insights is becoming equally essential.
FAQs
Q1. What is AI in business analytics?
A: AI in business analytics refers to using machine learning models and algorithms to analyze data, identify patterns, and support faster, more accurate decision-making.
Q2. How does AI improve business analytics?
A: AI improves business analytics by automating data processing, reducing errors, identifying hidden patterns, and enabling faster insights compared to traditional manual analysis methods.
Q3. Do business analysts need to learn AI?
A: Business analysts do not need deep AI expertise, but understanding machine learning basics and working with AI tools is increasingly important in modern analytics roles.
Q4. What tools are used in AI-driven business analytics?
A: Common tools include Python, SQL, Power BI, Tableau, and machine learning libraries that help analyze data, build models, and create visual reports.
Explore Related Courses


COMMENTS(0)
Explore Related Courses
Our Popular Insights
Careers are shifting faster than ever, and staying relevant takes more than experience. Explore UniAthena’s most-read blogs for sharp insights, emerging skills, and practical pathways that help you move forward with clarity and confidence in a changing professional world.


🌟 Students of the Month | May – June 2026 🌟
Read More
1
mins read


🌟 Students of the Month | May – June 2026 🌟
Read more
1
mins read
Get in Touch

It’s Time to Start
Join NowMost Popular Online Specialization
- Master of International Business Administration
- Master of Business Administration
- MBA in General Management- FastTrack
- Master in Innovation and Entrepreneurship
- MBA-Family Business Management
- Master in Procurement and Contract Management
- Extended Diploma in Business Analytics (SCQF Level 11)
- Diploma in Supply Chain and Logistics Management (SCQF Level 11)
- Strategic Human Resource Management Practitioner
- Master in Data Science
- Master in Engineering Management
Trending Online
- Integrated Doctorate of Business Administration
- Postgraduate Certificate in Finance for Next Generation Managers
- Master of Business Administration- General Management (Fast Track)
- Postgraduate Certificate in Socio-Economic and Legal Framework
- Postgraduate Certificate in Business Sustainability
- Certified Manager
- Supply Chain Management Practitioner
- MBA - AI in Business
- MBA - Accounting & Finance
- Master in Supply Chain and Logistics Management
Top Universities Online Certificates
- Postgraduate Certificate in International Marketing Management
- Postgraduate Certificate In International Human Resource Management
- Postgraduate Certificate in Strategic Management
- Postgraduate Certificate in Procurement & Contracts Management
- Postgraduate Certificate in Business Analytics
- Postgraduate Certificate in Strategic Supply Chain & Logistics Management
- Postgraduate Certificate in Human Resource and Leadership
- Project Management Practitioner
- Postgraduate Certificate in Supply Chain Design & Implementation
- Postgraduate Certificate in Management Accounting and Finance
Accredited Online Degree Program
- MBA - Digital Transformation
- MBA - Family Business Management
- MBA - Marketing Management
- MBA in Quality Management
- MBA - Business Intelligence & Data Analytics
- MBA in Operations & Project Management
- MBA in Energy Management
- MBA In Construction & Safety Management
- Master in Organisational Leadership
- Master in Public Health
- Master in Construction Management
- Bachelor of Arts in Business Administration


UniAthena is an Ed-Tech, offering flexible, affordable learning solutions, including Free-Learning Upskilling Courses and Academic Programs in partnerships with accredited and globally renowned universities and professional qualification bodies.


Do you have any questions ?
Feel free to send us your questions or request a free consultation
Send a messageUK
Athena Global Education
Magdalen Centre,
Robert Robinson Avenue,
Oxford, OX4 4GA, UK
Phone : 01865 784299
MIDDLE EAST
Athena Global Education FZE
Block L-03, First Floor,
P O Box 519265, Sharjah Publishing City,
Free Zone, Sharjah, UAE
Phone : +971 55 879 5492
INDIA
Uniathena Private Limited
9A,Midas Tower
Phase 1
Hinjewadi Rajiv Gandhi Infotech Park
Pune-411057
Phone: +91 9145665544
All Copyrights Reserved @ Athena Global Education 2021-2026