-

Bachelor's

-

Masters
-

MBA
-

Doctorate
-

Micro Credit
-

Explore all Courses
-
Postgraduate Certifications

-
Postgraduate Diploma
-
Undergraduate Diploma


Predicting Market Movements via Time Cycles

Blog
|3
MINS READ
|0
|11
15 February, 2022
Introduction:
A significant development in modern studies that have attracted techno financial analysts is the time cycle and the role it plays in financial markets.
Indeed, time is one of the most important factors that can define the movements of the market, as when you study the past of a specific instrument, you will find the evidence of the famous saying "History repeats itself"!
I do believe that by studying the past, you can predict the future as it is the most valuable principle dominating our life. It is also the principle that should be accepted and applied on charts by a technical analyst in order to gather more experience.
Studying the time cycles could teach you why peaks and troughs take place at specific times; additionally, you will learn why resistance levels or support levels are stronger than you expect at certain times.
Let us interpret this introduction within a short sentence as follows:
There is a relation between time and price behavior!
Major Time Cycles
As per Newton's perception of natural law, every action has a reaction and that is why everything moves in cycles. You can make money when fluctuations and fast moves occur and as we will see below, this kind of price behavior occurs at the end of major cycles.
1-Ten-year cycles:
If you are investing and trading in the financial market, you will discover that extreme highs or lows are placed every ten years after an extraordinary fluctuation. Sometimes, these tops or bottoms come out after ten and a half or eleven years.
We can divide the range of the 10-year cycle- equals 120 months- the same way we divide the range between bottoms and tops to get resistance and support levels.
Consequently, one-half of the cycle will be 5 years, whilst one-fourth will be 2 and half years, and one-eighth will be 15 months, and so on.
These aforesaid periods offer a change in trends, so please open any chart of any instrument and check the price movements every ten years!
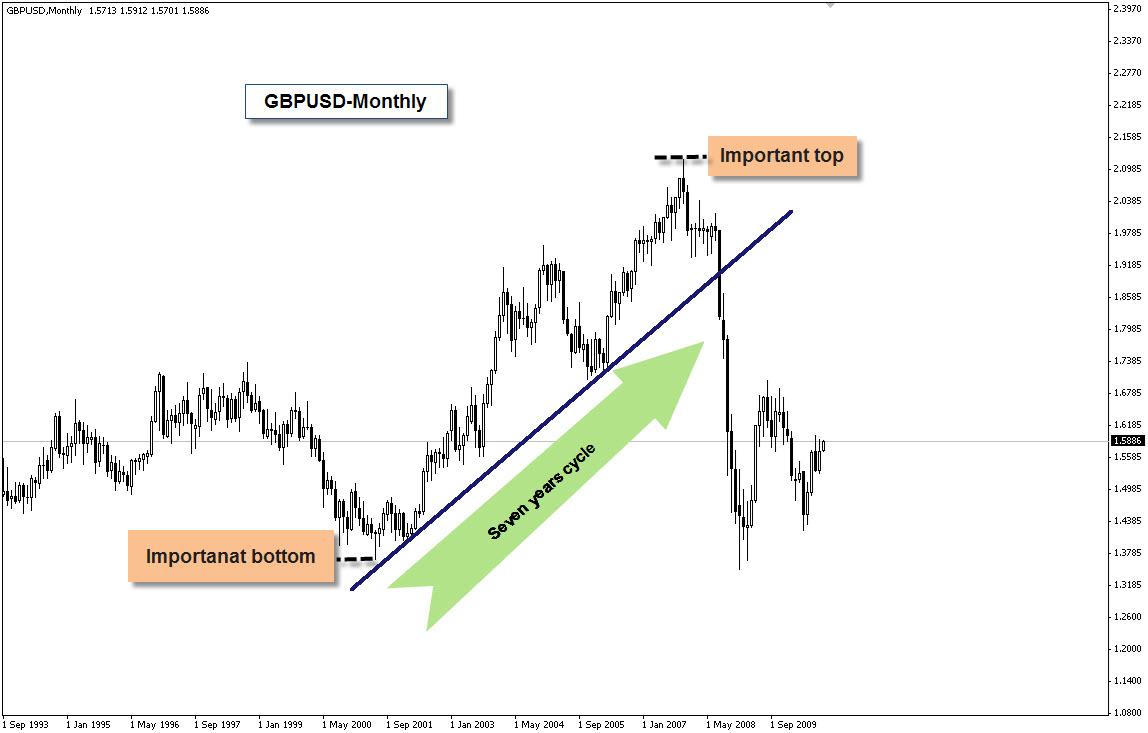
2- Seven-year cycle:
This cycle consists of 84 months and if we observe a period of 7 years from any top or bottom, we will find that the fluctuation and maybe another important high or low is placed around the last month of those 7 years.
The same case occurs around month number 42 and month number 44 - one half of the cycle-.
Many bottoms and tops also around the 21st month to the 23rd- one-fourth of the cycle -.
Sometimes, the market prints bottoms or tops 10 to 11 months from a previous top or bottom. This is since this period is one-eighth of the 7-year cycle!
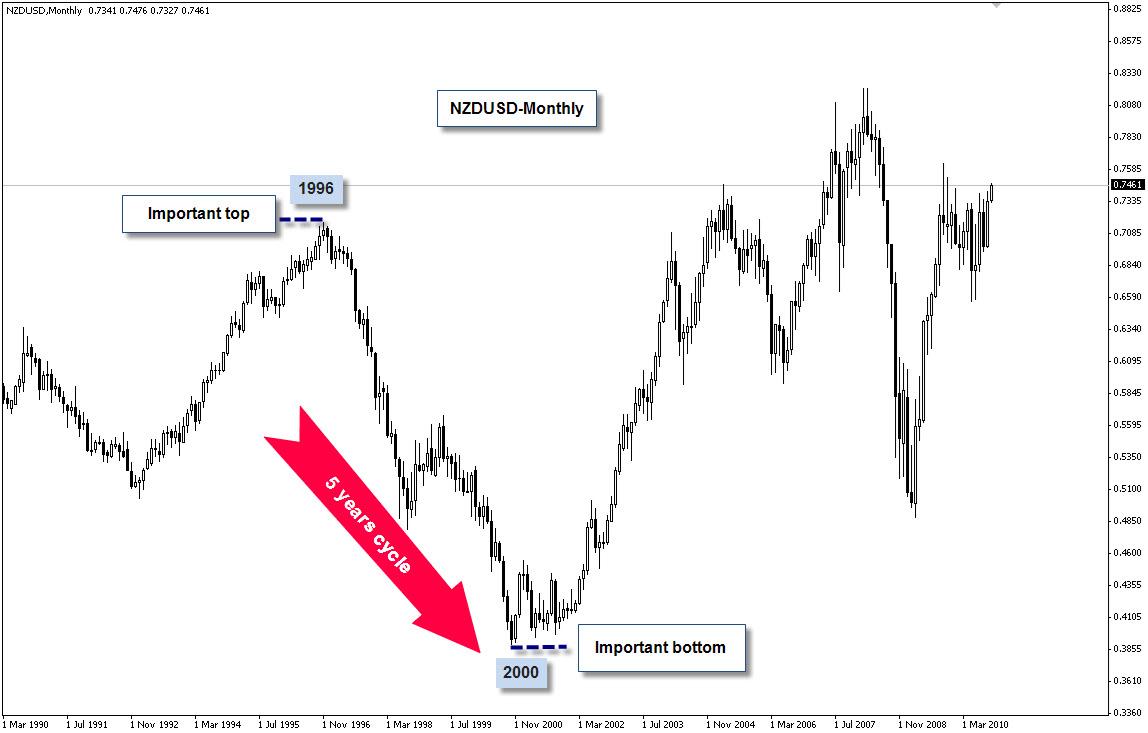
3- Five-year cycle:
This is the smallest complete cycle and as we discussed earlier, its importance comes from the role it plays as one half of the 10-year cycle.
4-Minor Cycles:
Minor cycles are 3 years and 2 years, while the smallest cycle is one year which often shows a change in trend in the 10th or 11th month.

Rules for future cycles:
- We should begin with extreme or historical tops and extreme bottoms to determine all cycles, either major or minor.
- Prices move in 10 years cycles and they are divided into 5 years cycle up and it is followed by 5 years cycle down.
- The 5 years upcycle runs as follows: 2 years up, 1 year down, and 2 years up.
- A bear cycle often runs 5 years down as follows: 2 years down and 2 years up and I year down.
- The end of 5 years comes in the 59th or 60th month.
Written by: Amir El Araby


Sky Option
United Arab Emirates
COMMENTS()
Latest Insights From UniAthena


Our Popular Courses


Athena Global Education FZE is an Online Education provider offering self-paced Masters, Doctorate, and Microcredit programs in collaboration with European Universities and Reputed Professional Qualifications Authority. Athena is the latest venture of Westford Education Group, a higher education services provider since 2009.


Westford Education Group (WEG) is a leading provider of accredited international education to aspiring learners across the globe. Westford is fast emerging as a reputed brand of global education providers.
UK
Athena Global Education
Magdalen Centre,
Robert Robinson Avenue,
Oxford, OX4 4GA, UK
Phone : 01865 784299
MIDDLE EAST
Athena Global Education FZE
Block L-03, First Floor,
P O Box 519265, Sharjah Publishing City,
Free Zone, Sharjah, UAE
Phone : +971 65 31 2511
INDIA
Uniathena Private Limited
9A,Midas Tower
Phase 1
Hinjewadi Rajiv Gandhi Infotech Park
Pune-411057
Phone: +91 9145665544
All Copyrights Reserved @ Athena Global Education 2021-2024